
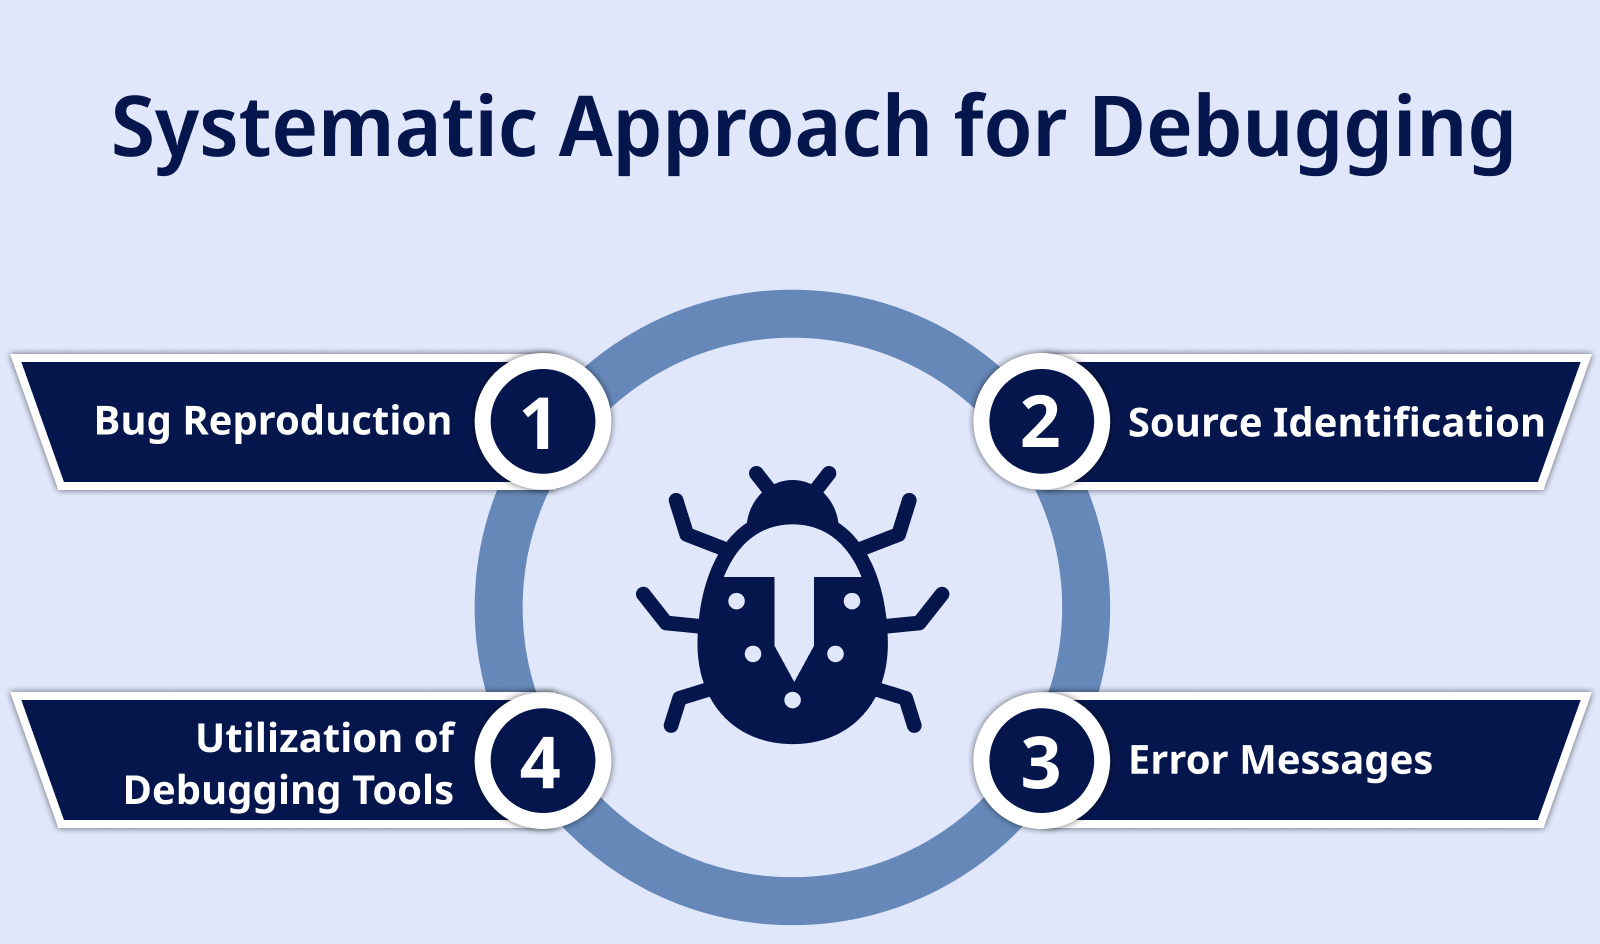
Debugging is an essential skill for every developer. It requires patience, logical thinking, and a structured approach. Here’s how you can develop strong debugging skills and effectively identify and fix issues in your code.
1. Understand the Problem Clearly
✅ Read error messages carefully—most of the time, they tell you what went wrong and where.
✅ Reproduce the issue consistently before debugging.
✅ Identify expected vs. actual behavior in your code.
🔹 Example:
If you encounter NullPointerException in Java, trace back to where the variable could be null before using it.
2. Use Debugging Tools Efficiently
✅ Integrated Debuggers in IDEs (IntelliJ, Eclipse, VS Code, PyCharm) help step through code execution.
✅ Breakpoints allow stopping execution at specific lines to inspect variables.
✅ Watches help track variable values during runtime.
🔹 Example (Debugging in IntelliJ/Eclipse)
- Set a breakpoint on a suspicious line.
- Run in Debug mode (
Shift + F9in IntelliJ). - Use Step Over (
F8), Step Into (F7), and Step Out (Shift + F8) to trace execution. - Quick Debugging guide for Eclipse
3. Use Logging and Print Statements
✅ Insert System.out.println(), console.log(), or print() statements to inspect variable values.
✅ Use structured logging with frameworks like Log4j2 (Java) or Winston (Node.js).
✅ Avoid excessive logging in production—use appropriate log levels (INFO, DEBUG, ERROR).
🔹 Example (Java Logging with Log4j2)
import org.apache.logging.log4j.Logger;
import org.apache.logging.log4j.LogManager;

public class DebugExample {
    private static final Logger logger = LogManager.getLogger(DebugExample.class);

    public static void main(String[] args) {
        logger.info("Application started");
        logger.debug("Debugging info here");
        logger.error("Something went wrong!");
    }
}
4. Isolate the Problem
✅ Divide and Conquer—comment out sections of the code and reintroduce them step-by-step.
✅ Use binary search debugging—comment out half of the code and check if the issue persists.
✅ Test one variable at a time to pinpoint the root cause.
🔹 Example: If your automation script is failing, disable some test steps and execute partially to find the failing part.
5. Use Version Control (Git) for Debugging
✅ Use git diff to check what changes caused the bug.
✅ Use git bisect to find the exact commit that introduced the bug.
✅ Use branches to test fixes without affecting main code.
🔹 Example (Finding Bug with Git Bisect)
git bisect start
git bisect bad   # Current commit has the bug
git bisect good <last-known-working-commit>
6. Learn to Read Stack Traces
✅ Stack traces show the exact file and line number of an error.
✅ Identify method calls and follow the execution flow to find the root cause.
✅ For deep stack traces, read from bottom to top (earliest cause is at the bottom).
🔹 Example (Java Stack Trace Analysis)
Exception in thread "main" java.lang.NullPointerException
    at com.example.Main.someMethod(Main.java:12)
    at com.example.Main.main(Main.java:8)

📌 The error occurs at line 12 inside someMethod(), which was called by main() at line 8.
7. Use Online Debugging Communities
✅ Search for similar issues on Stack Overflow, GitHub Issues, and Reddit programming forums.
✅ Learn to read and interpret documentation (official API docs).
✅ Ask questions effectively: Include error messages, code snippets, and steps to reproduce.
8. Develop a Debugging Mindset
✅ Think like a detective—eliminate possible causes logically.
✅ Be patient—debugging is a process of elimination, not magic.
✅ Stay calm and avoid frustration
 Learn 𝗦𝗲𝗹𝗲𝗻𝗶𝘂𝗺 (V4) with end-to-end real time project through one of the best Udemy course: https://shorturl.at/l7U3x Learn 𝗦𝗲𝗹𝗲𝗻𝗶𝘂𝗺 (V4) with end-to-end real time project through one of the best Udemy course: https://shorturl.at/l7U3x |


